
Lenders assess credit risk by a number of related measures. Discover how a detailed understanding of these measures can strengthen your organisation as a safe and effective borrower.
CALCULATE, FORECAST, EXPLAIN
Most organisations have debt. Some have a lot of it. The more debt a borrower has, the more its lenders worry about getting their money back or about extending further credit. Debt also involves risk to the borrower, because lenders have priority claims if the borrower defaults. Many corporate failures have been a consequence of excessive borrowing in earlier periods.
Lenders, credit rating agencies and other stakeholders need to measure how much debt the organisation has, and whether this amount is too much.
WARNING SIGNS
Indicators used to assess whether or not debt levels are excessive include:
- Debt compared with net worth;
- Debt compared with cash flow or profit; and
- Debt servicing costs compared with profit or cash flow.
Current and prospective lenders take these measures very seriously. For this reason they are key drivers of the availability and cost of debt finance.
MEASURE FOR MEASURE
Particularly important for treasurers are two closely related risk measures that compare debt with net worth:
(1) Debt to equity ratio, often known as ‘gearing’; and
(2) Debt to total capital employed ratio, also known as ‘leverage’.
‘Equity’ is the capital provided by shareholders, often abbreviated to ‘E’; while ‘capital employed’ is the total of debt (‘D’) and equity together. Capital employed is often written as: ‘D + E’.
Borrowing documentation frequently contains financial covenants. Under these covenants the borrower promises to maintain leverage, gearing or other credit risk measures within specified limits. Breaching covenants can have severe adverse consequences. So, the treasurer needs to be able to calculate, forecast and explain the covenanted measures with confidence.
WHY HAVE BOTH?
Gearing and leverage, as defined above, are not two different things. They use the same information expressed as two different figures. Indeed, we could calculate either of them directly from the other.
Market participants have different valid perspectives on financial situations. Treasurers need the flexibility to understand many perspectives. The best treasurers communicate quickly and effectively from multiple perspectives, and express their recommendations using appropriate conventional bases, in the ways that stakeholders are used to seeing information presented.
Consistency of approach and definition are essential, especially when making comparisons.
SUBTLE DIFFERENCES
Let’s calculate gearing and leverage, and see how they differ. Both measures are expressed as percentages. We need two inputs for our
calculations: debt (D) and equity (E).
Definitions of debt and equity are critically important.
Debt can include or exclude certain items, such as cash, short-term borrowings, leases, pensions and other provisions.
Equity may also be adjusted, for example, to exclude intangible assets, such as goodwill.
Gearing
Gearing is usually defined as: Gearing = D ÷ E.
Let’s start by assuming a relatively small amount of debt, for example: D = 1 and E = 4.
Gearing = 1 ÷ 4 = 25%
Increasing the debt to 2 and reducing equity to 3 increases gearing: 2 ÷ 3 = 67%.
A further rise of debt to 3, and reduction of equity to 2, increases gearing even more: 3 ÷ 2 = 150%.
These results are summarised in the table below:
| Grearing = D ÷ E | |||
| D | 1 | 2 | 3 |
| E | 4 | 3 | 2 |
| Gearing | 25% | 67% | 150% |
Leverage
Leverage uses exactly the same inputs, but combines them in a slightly different way.
Leverage is usually defined as: Leverage = D ÷ (D + E).
For this calculation, we need capital employed (D + E). Let’s use the same inputs as for gearing: D = 1 and E = 4.
D + E = 5
Leverage = D ÷ (D + E)
= 1 ÷ 5
= 20%
Continuing with the same examples as before, the leverage figures are summarised in the table below:
| Leverage = D ÷ (D + E) | |||
| D | 1 | 2 | 3 |
| E | 4 | 3 | 2 |
| Leverage | 20% | 40% | 60% |
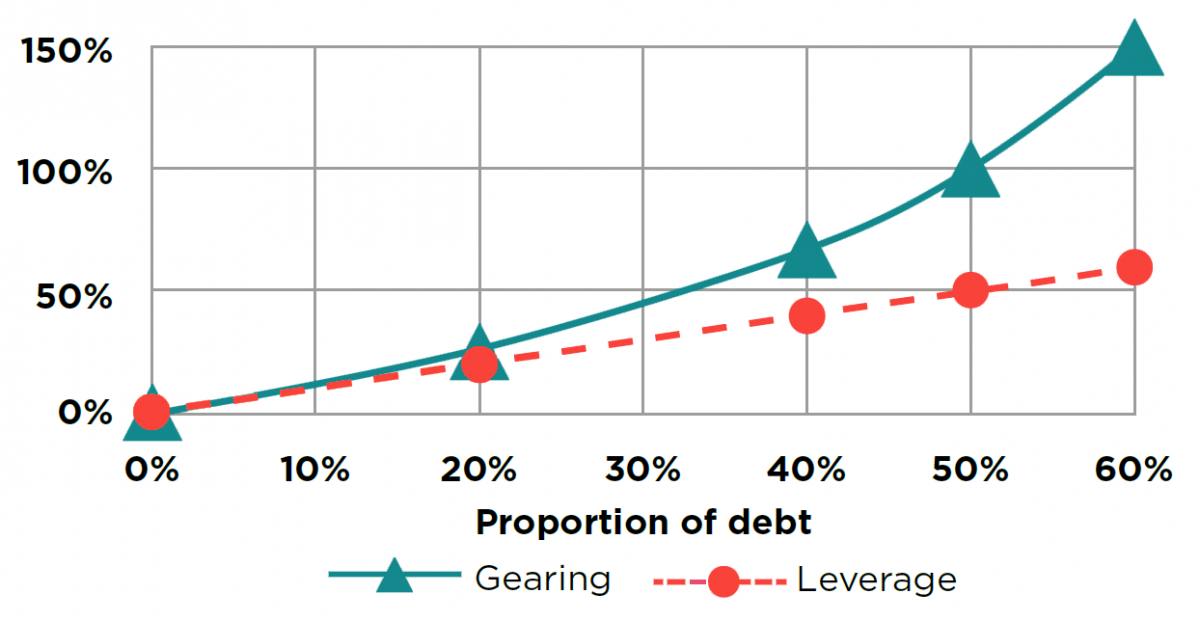
INCREASING DIVERGANCE
Gearing and leverage calculations can give significantly different numbers for exactly the same base values of debt and equity. The
greater the relative amount of debt, the greater the difference between gearing and leverage. Gearing is a larger number than leverage, and it grows ever faster as the proportion of debt increases.
This increasing divergence is clear when we plot our results on the same graph (see below).
WHERE ARE MY FORMULAE?
Many calculations need definitions and formulae. Examples include D ÷ E and D ÷ (D + E), which we’ve applied in this article.
Realistically you might not always have a formula sheet to hand. Even if you do have one, no formula sheet can ever include all the formulae you might possibly want, in the most convenient order.
Consistent practice is the only way to get familiar with important formulae, and accordingly quick and comfortable with essential calculations.
Durrant Inc has debts (non-current liabilities) of $4m and equity of $12m.
Calculate the company’s gearing and its leverage.
(answer below)
____________________
Author: Doug Williamson
Contributor: Jonathan Jeffery
Source: The Treasurer magazine
Want to learn more about treasury and cash management?
Choose from:
• eLearning courses: 45-90 minutes to complete, available online 24/7.
• Training courses: live skills-based training sessions.
• Treasury and Cash Management qualifications: internationally recognised courses from entry to master level.
All our courses will provide you with valuable knowledge as well as easy-to-share digital credentials to demonstrate your learning achievements.
Discover more resource articles
| Answers to question Gearing = 33% ($4m debt ÷ $12m equity) Leverage = 25% ($4m ÷ $16m (= $4m + $12m)) |